Works
- Professional
- Personal
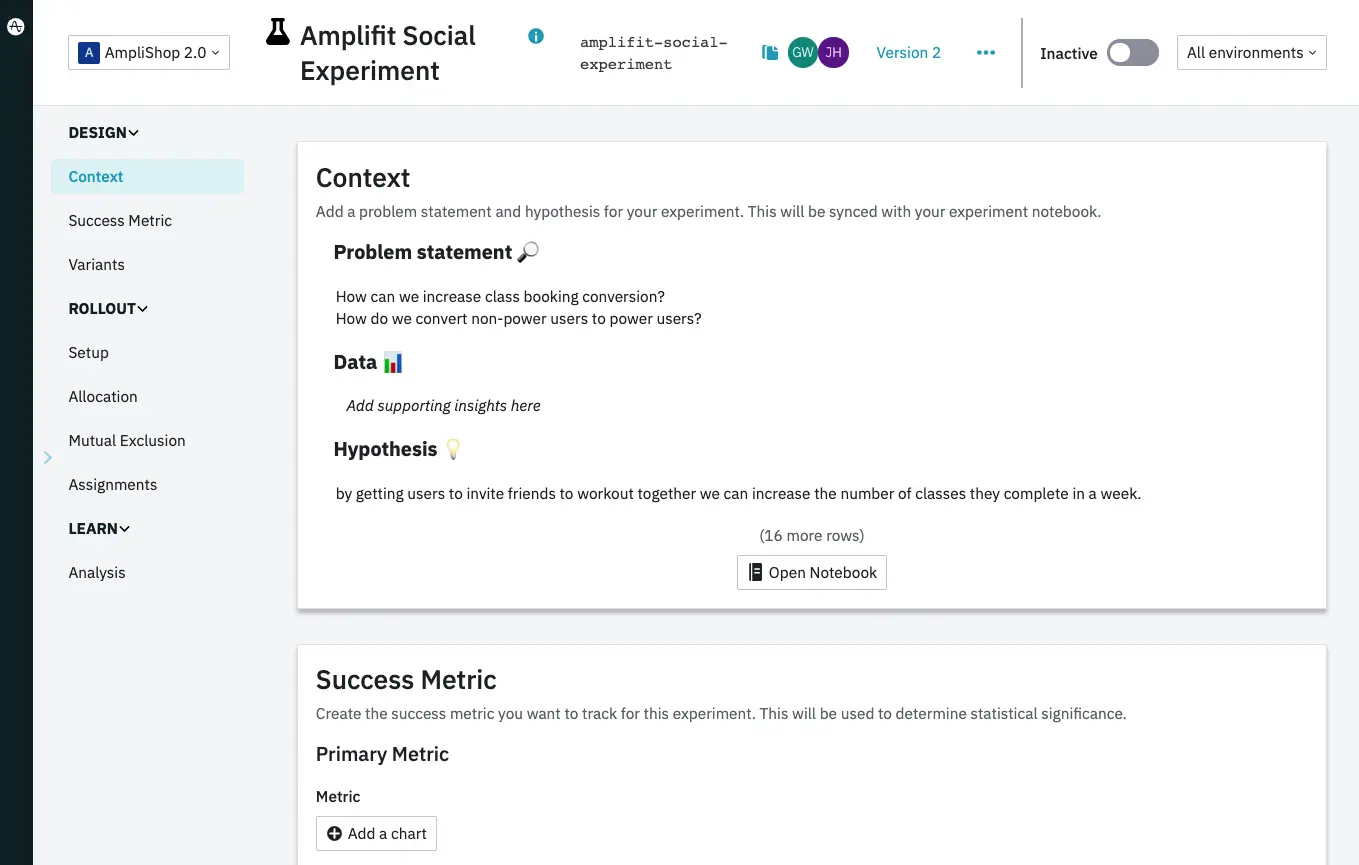
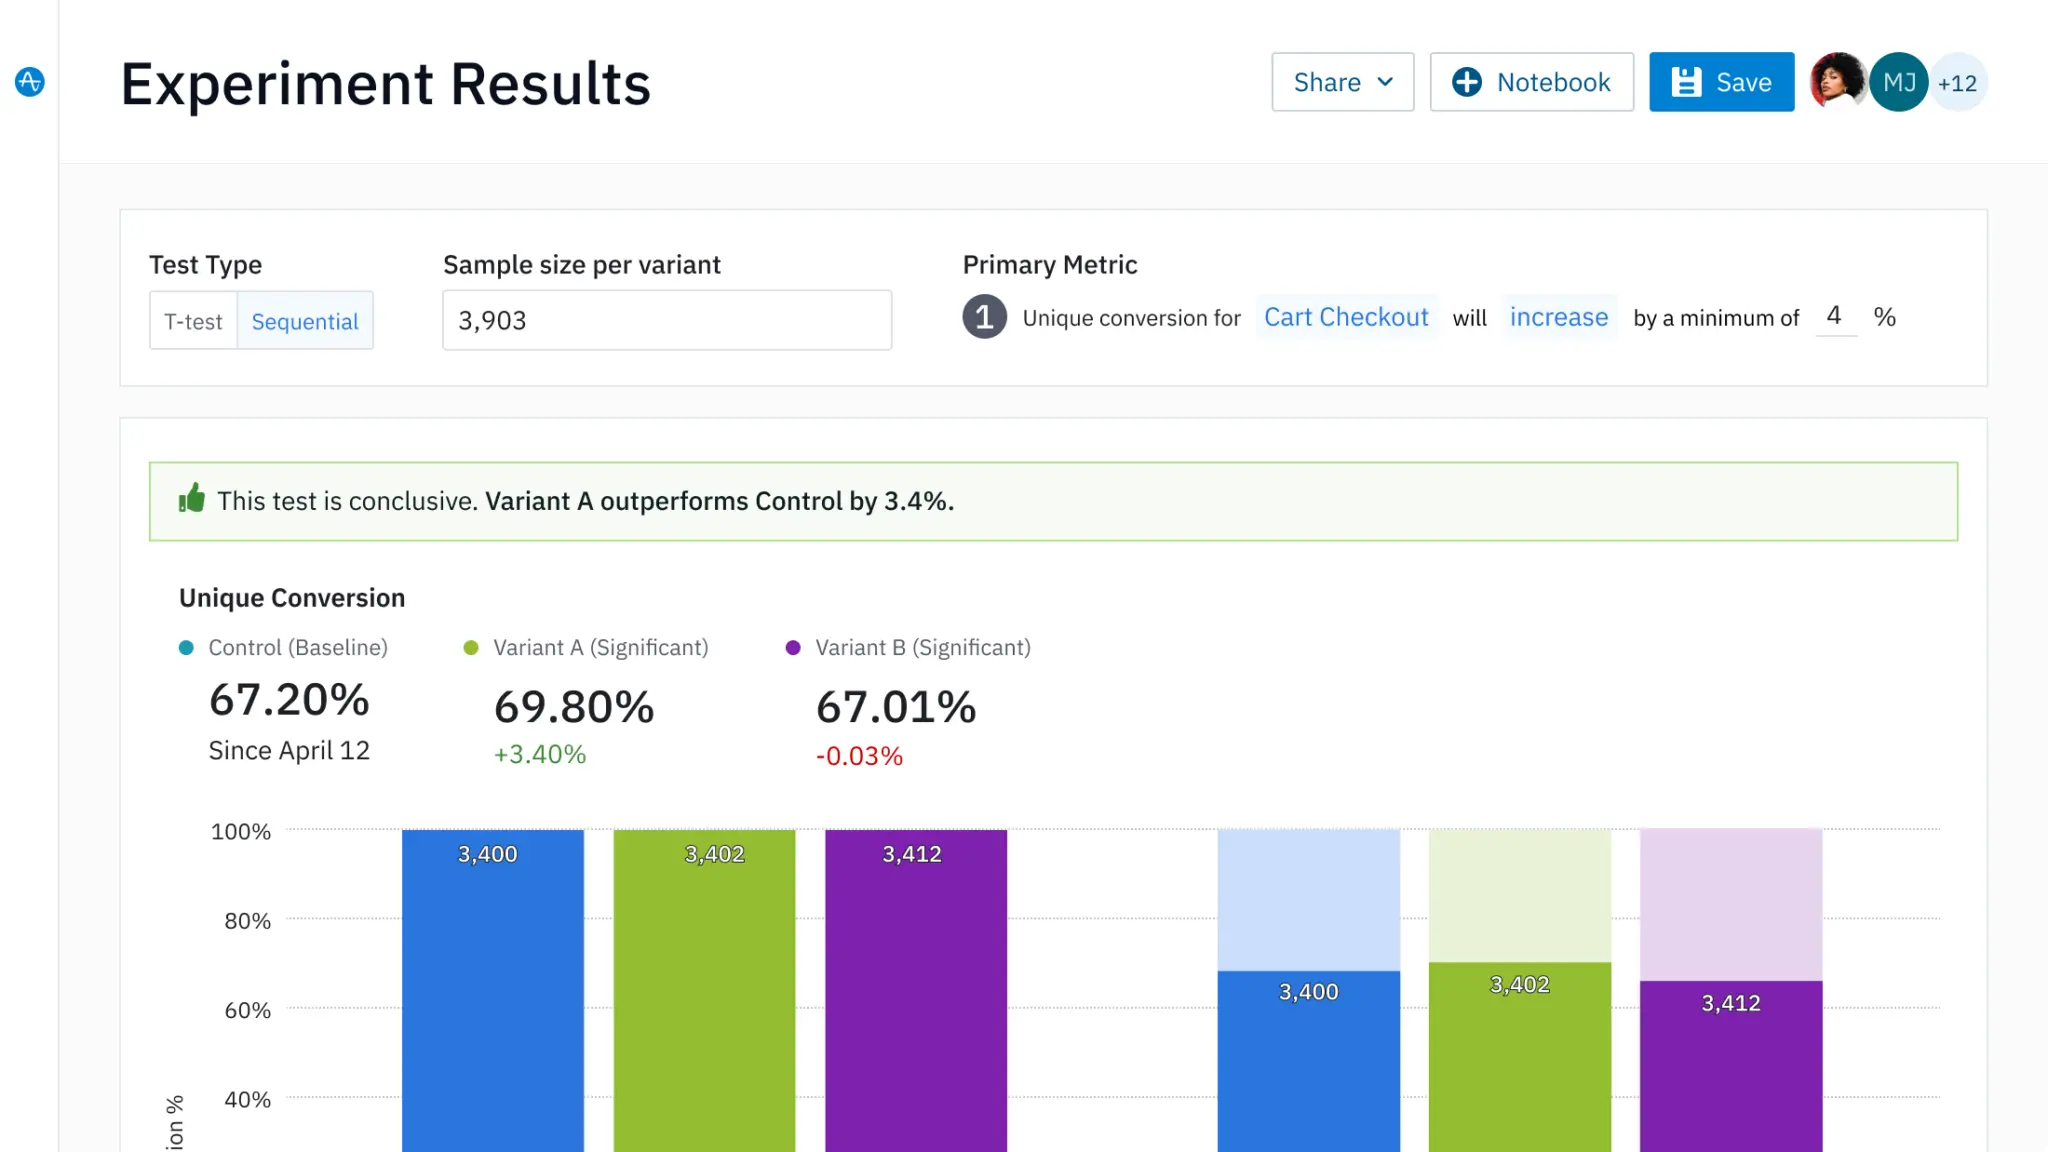
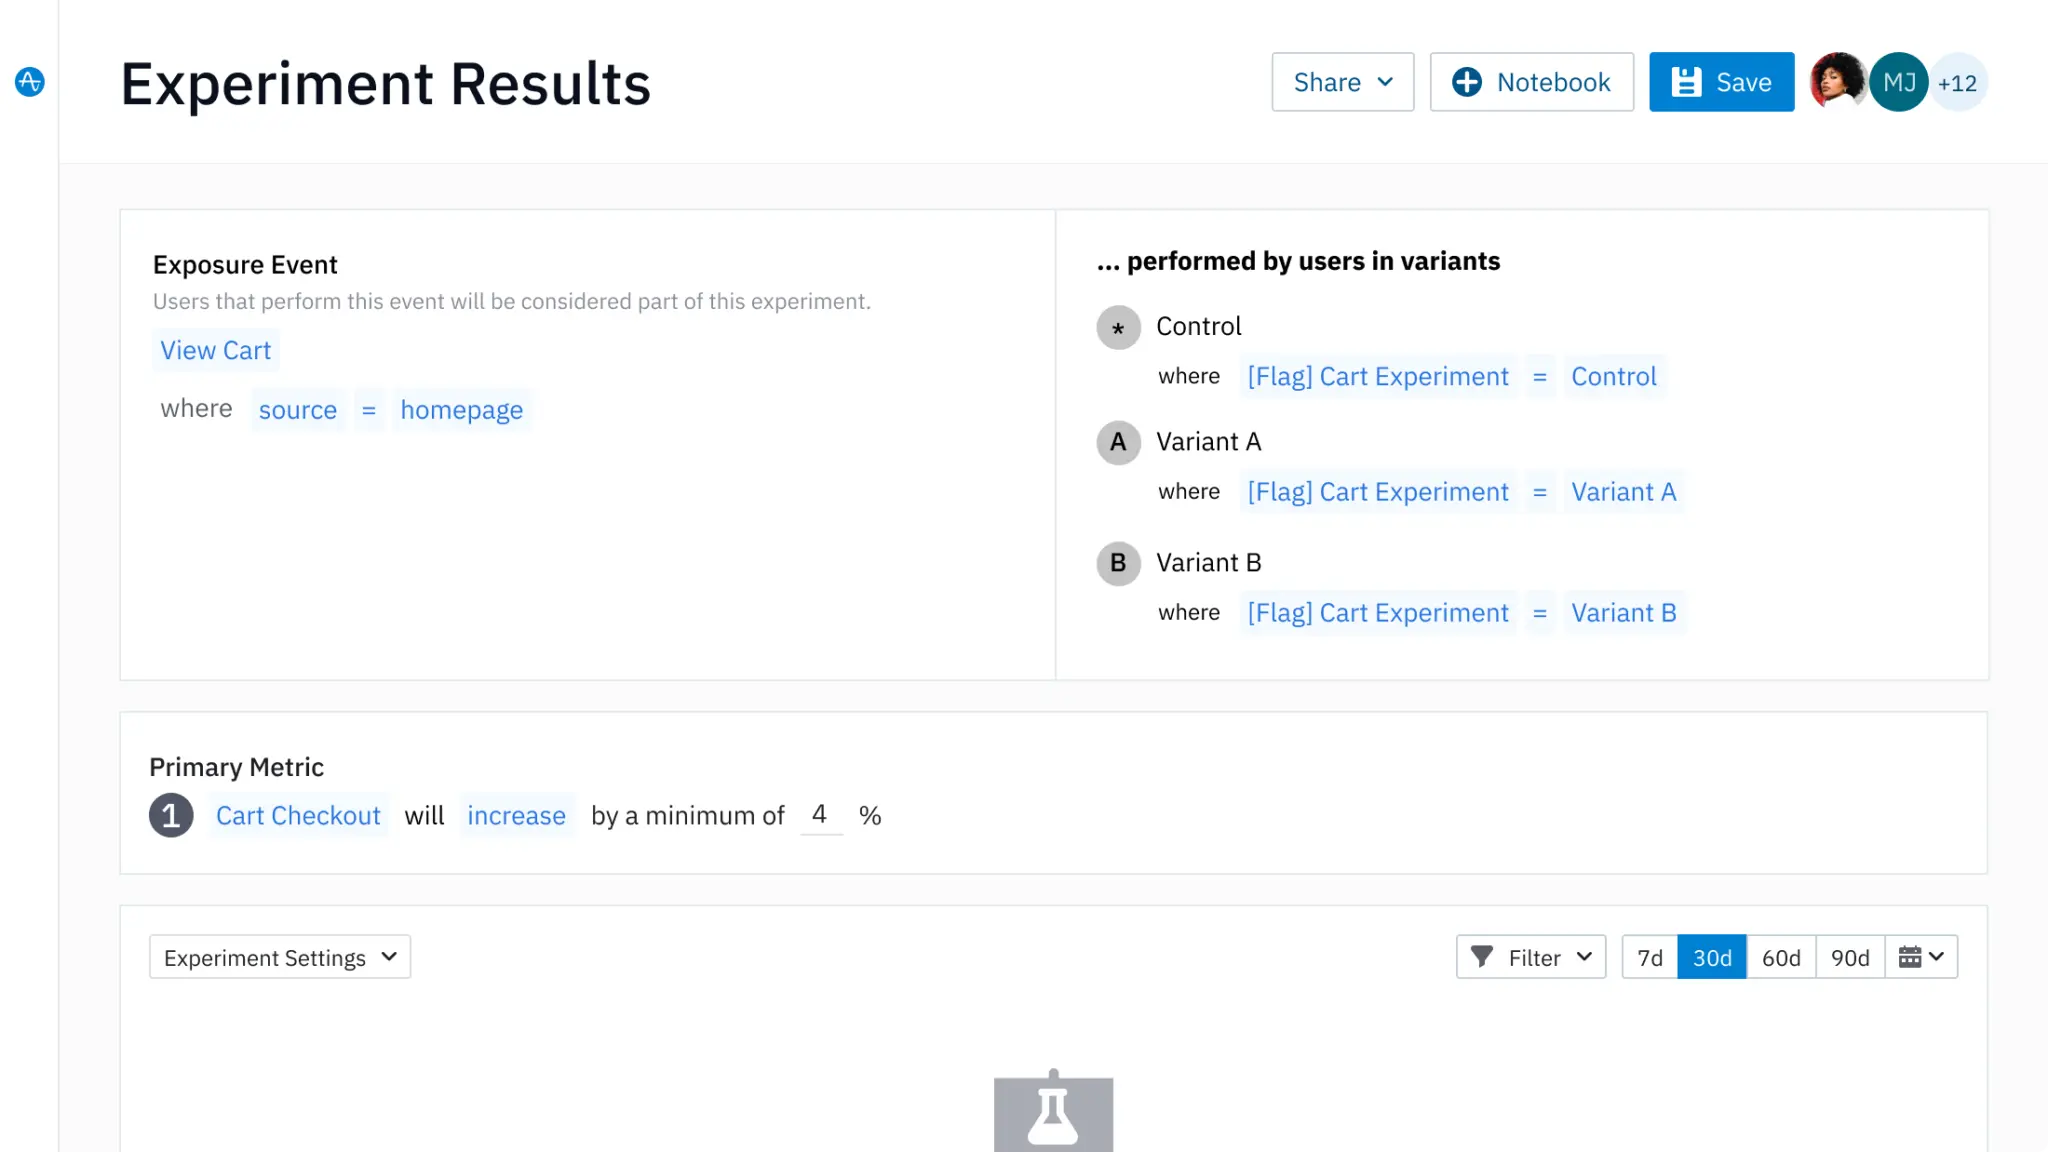
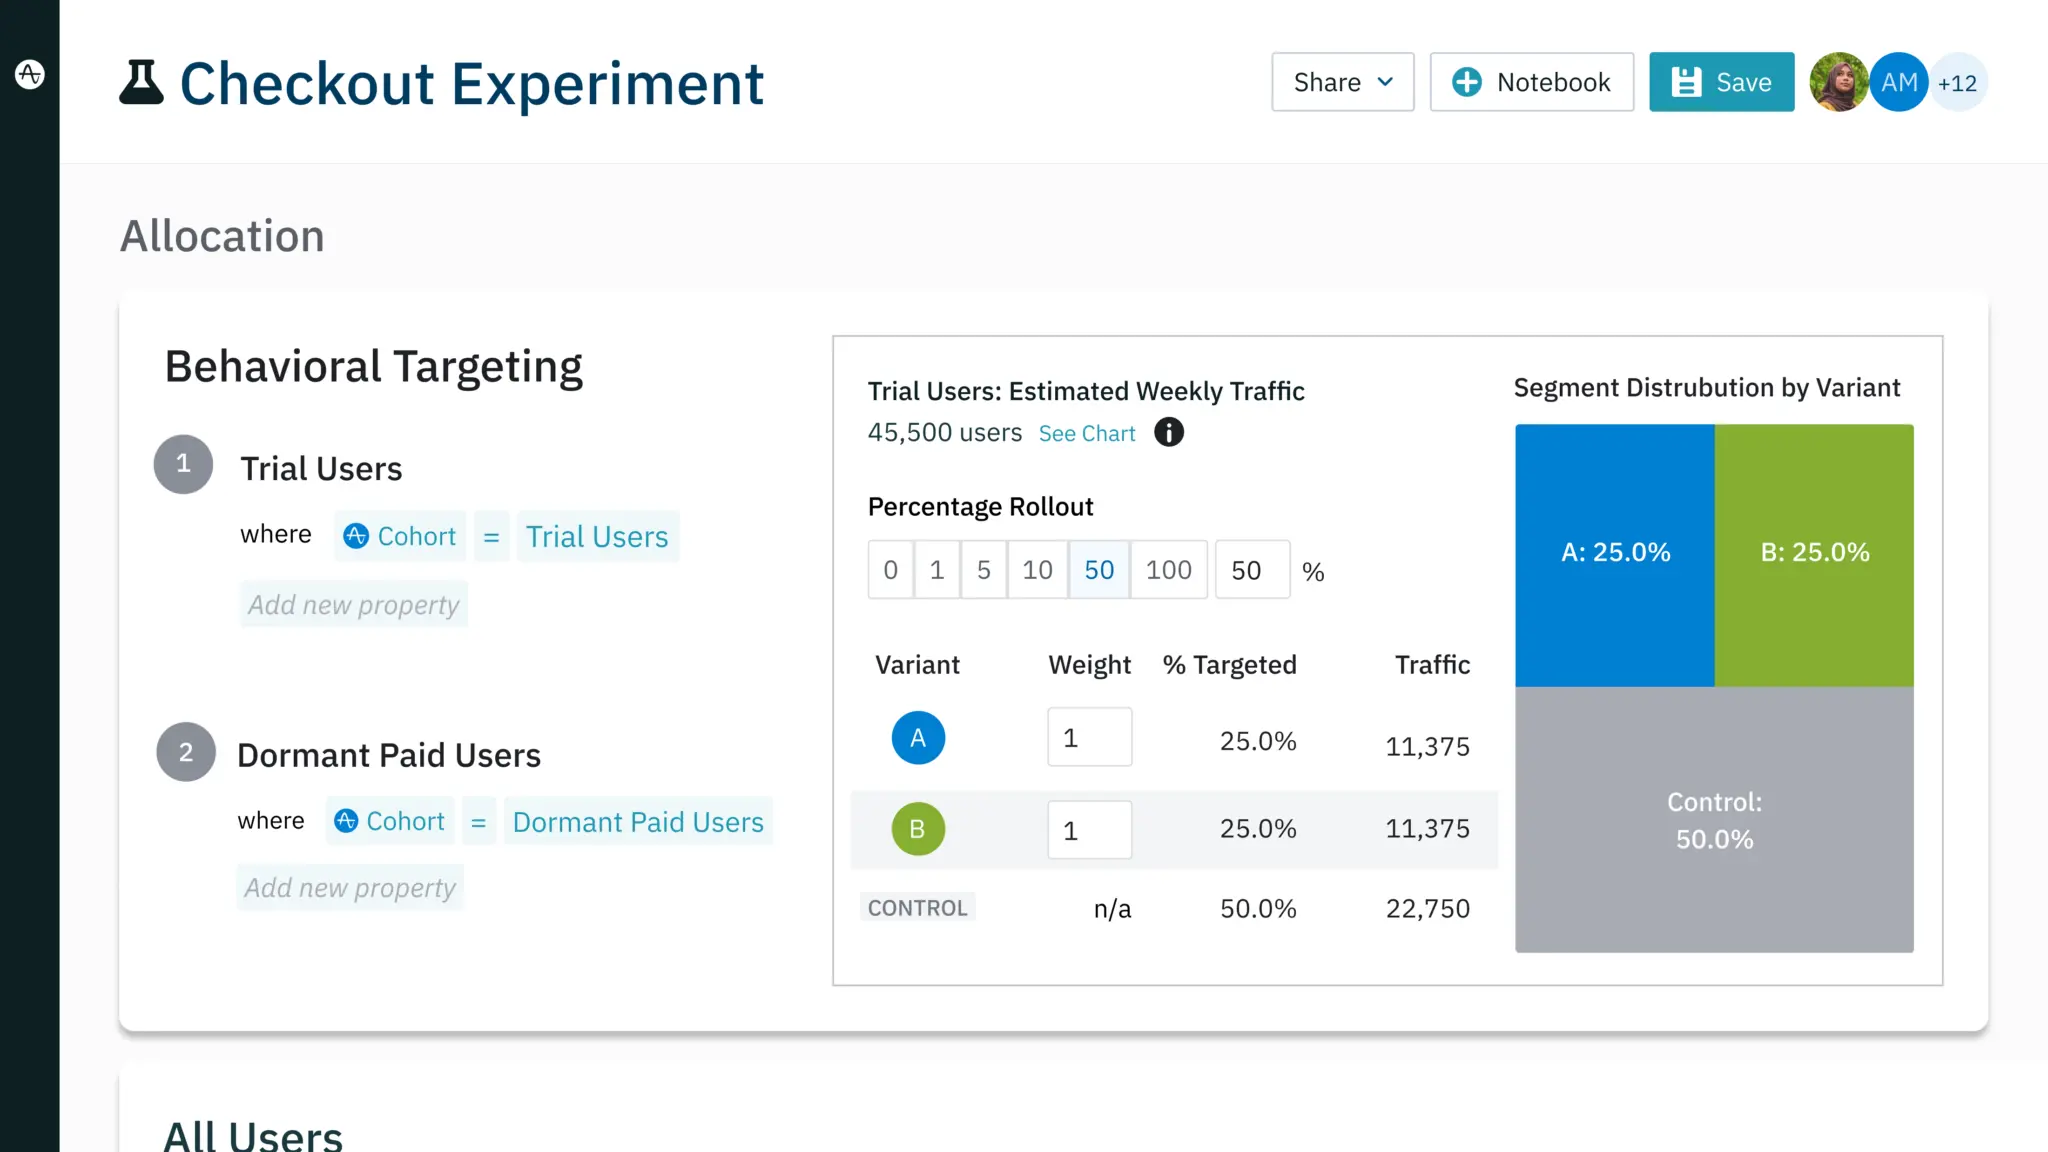
Amplitude is known for its analytics & charting, and my team designed Amplitude Experiment from early on to build on that foundation.
It was composed of two major parts - a standalone experiment platform with associated client SDKs, and a new chart type for bring-your-own experiment analysis within the existing Amplitude Analytics product.
One special piece I really enjoyed was working with data scientists to build a visualization of confidence intervals over time, and how those intervals shrink as more traffic rolls in to your experiment.
Technologies: Typescript + React, Apollo GraphQL.
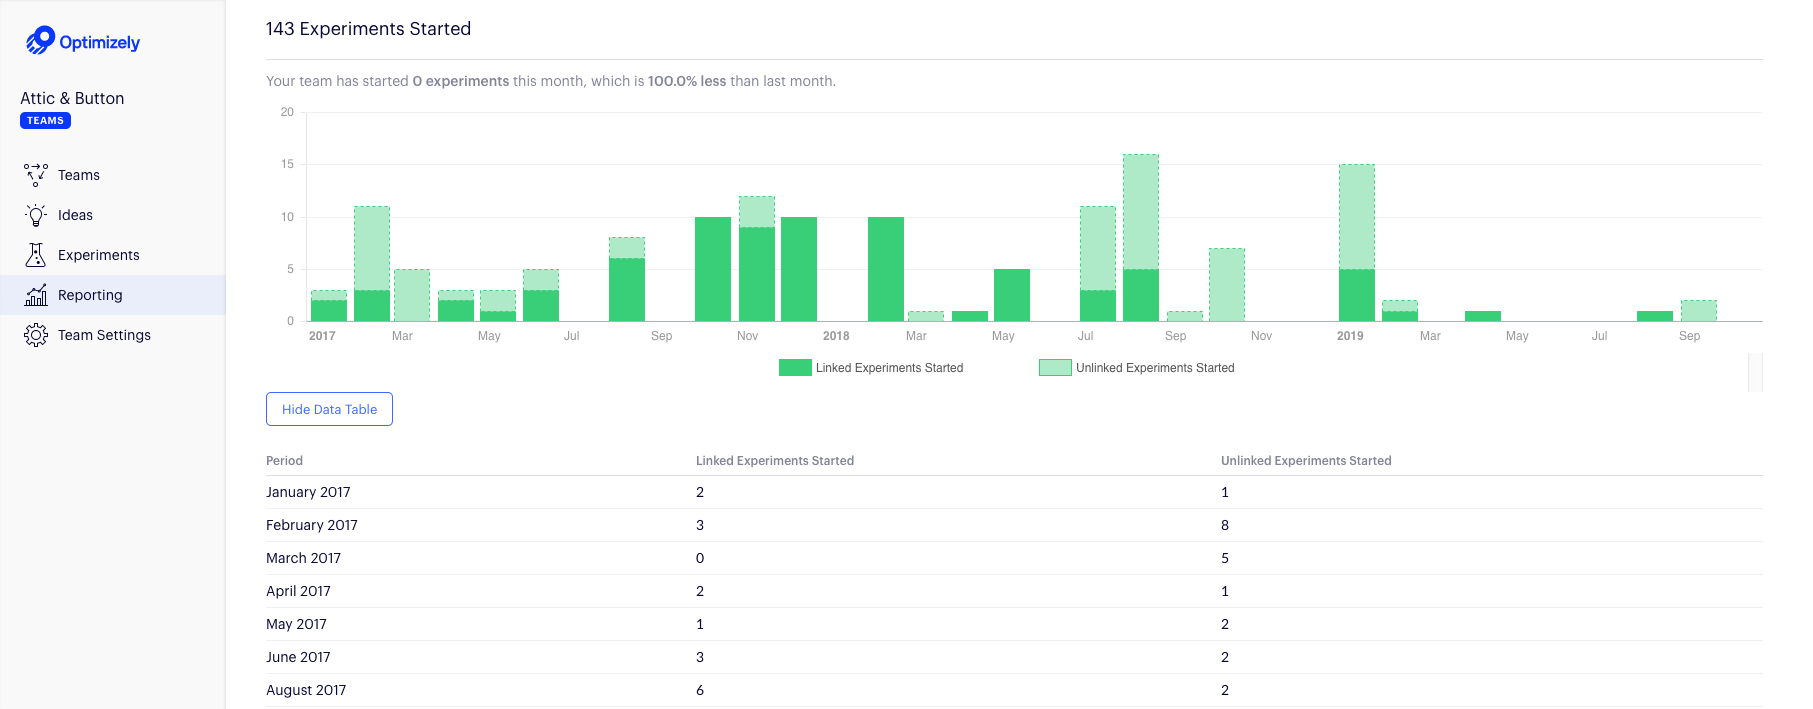
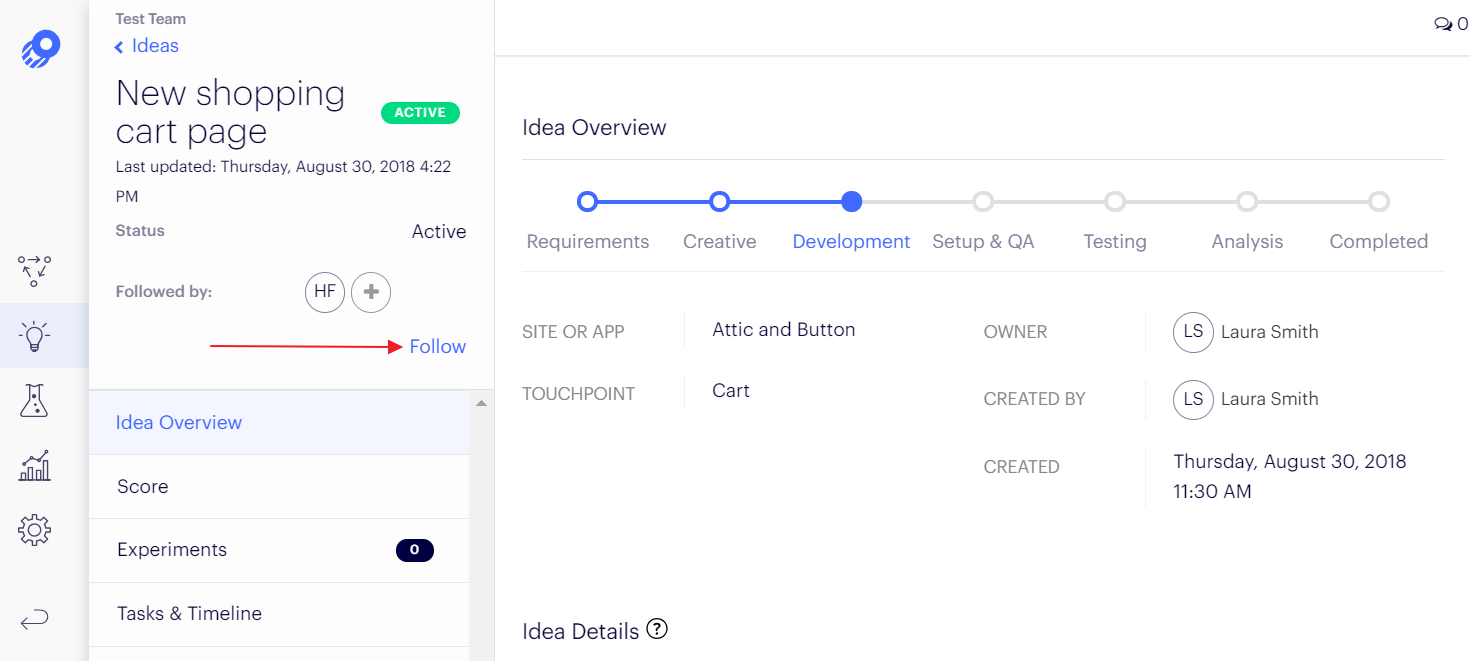
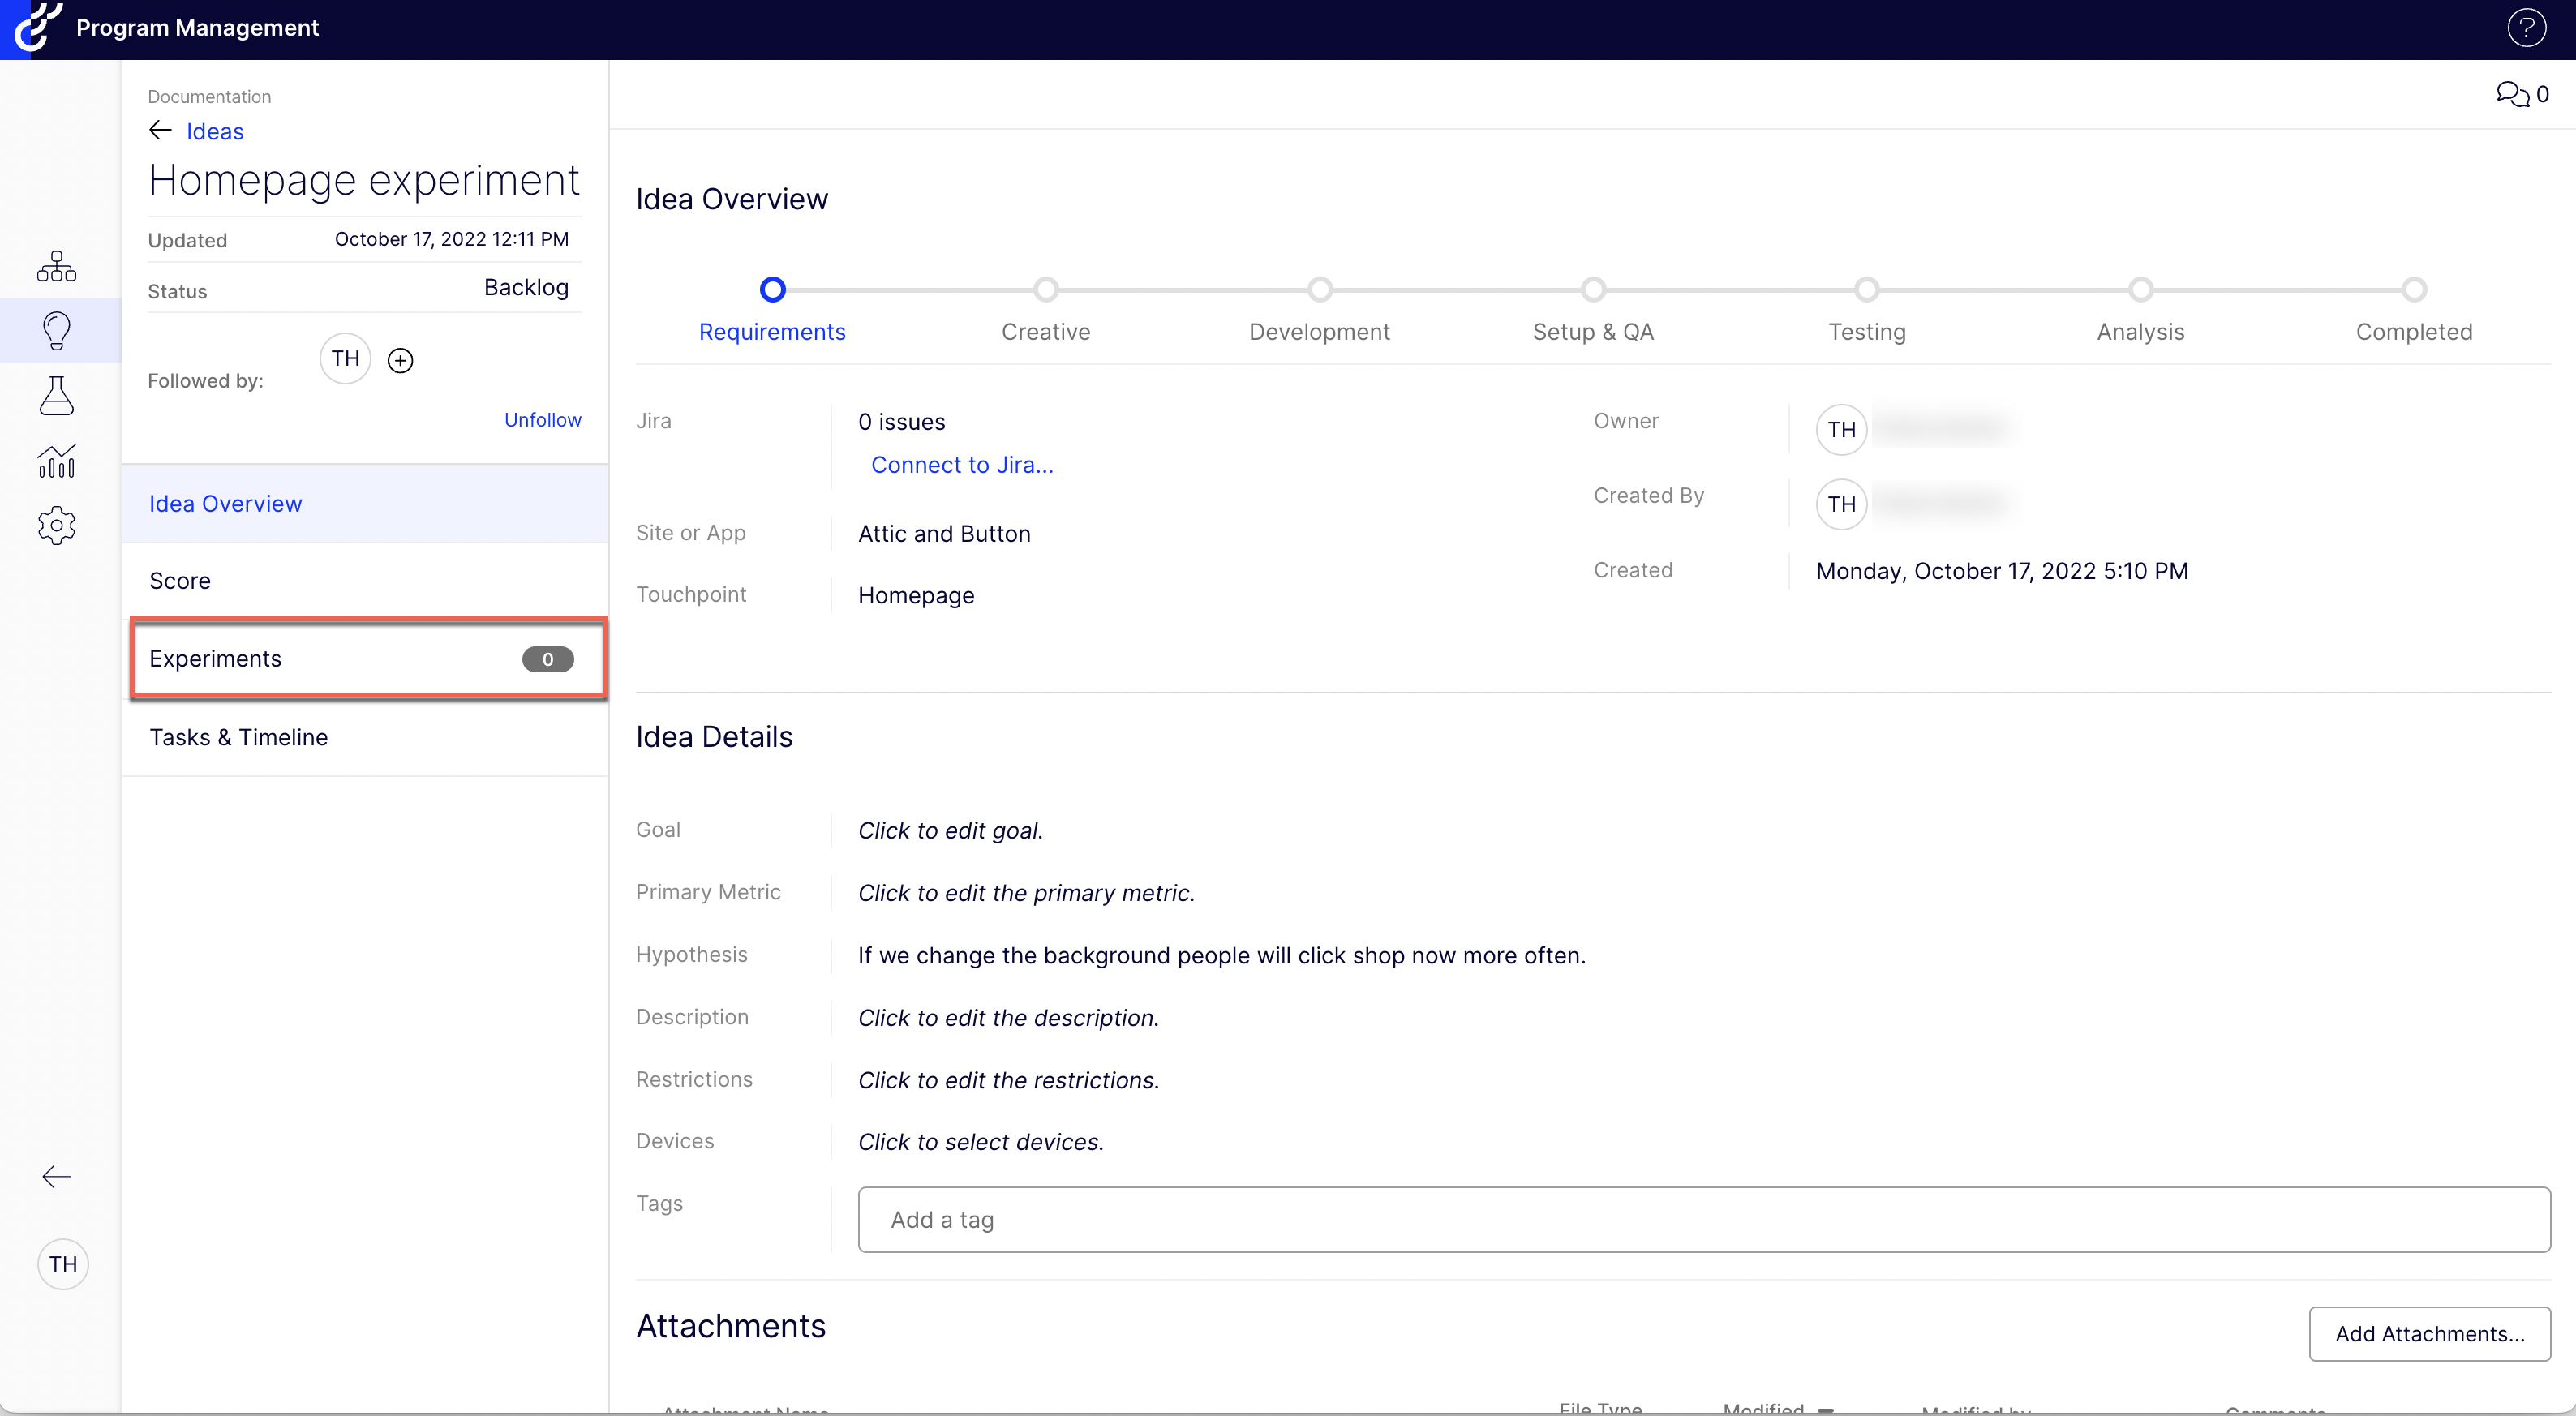
Optimizely is one of the early companies in the A/B testing platform space. Their Program Management product was a collaboration tool to coordinate running many experiments at once - across teams, even across experimentation platforms.
It also provided features to address the early lifecycle of building experiments that's often overlooked. It provided ideation, hypothesis, and voting features on top of the usual analysis capabilities common to every platform.
Technologies: AngularJS, migrated to / coexisted alongside React.
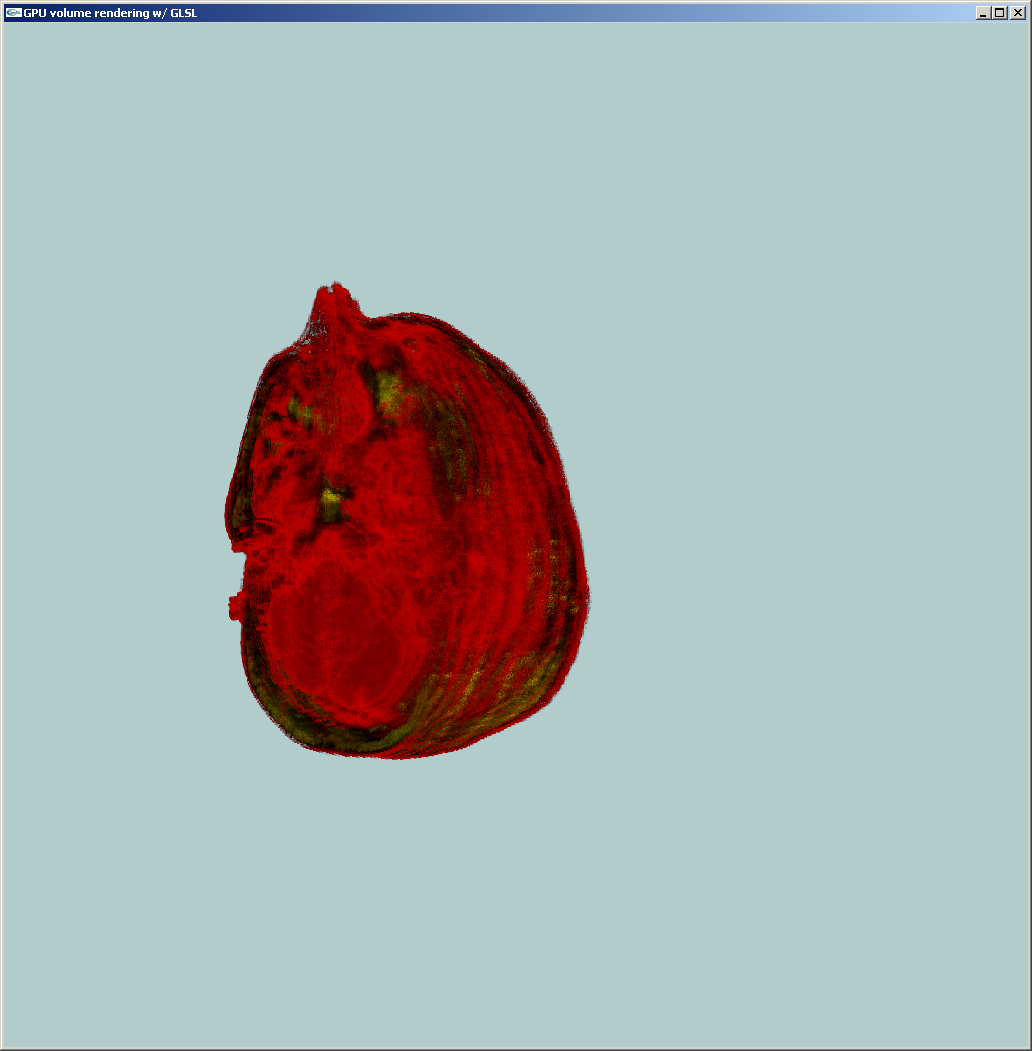
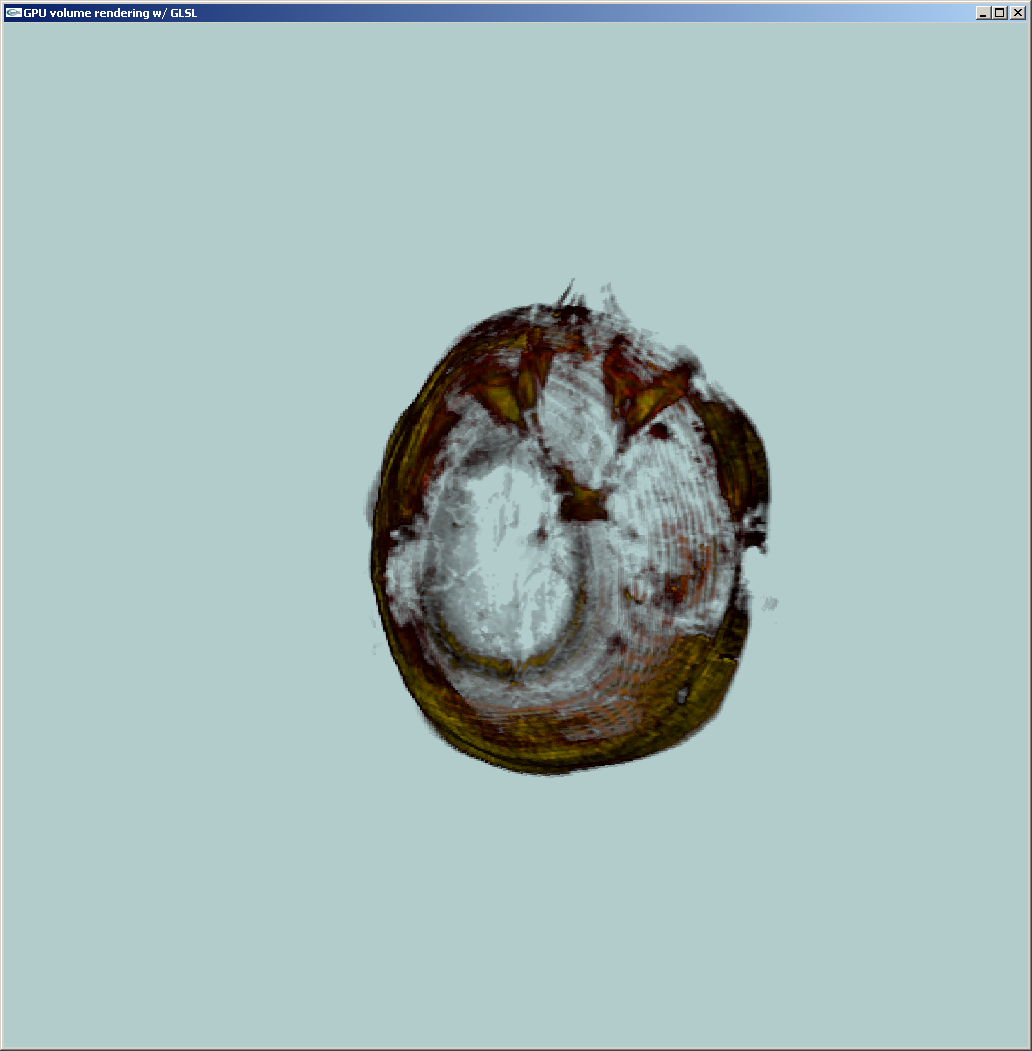
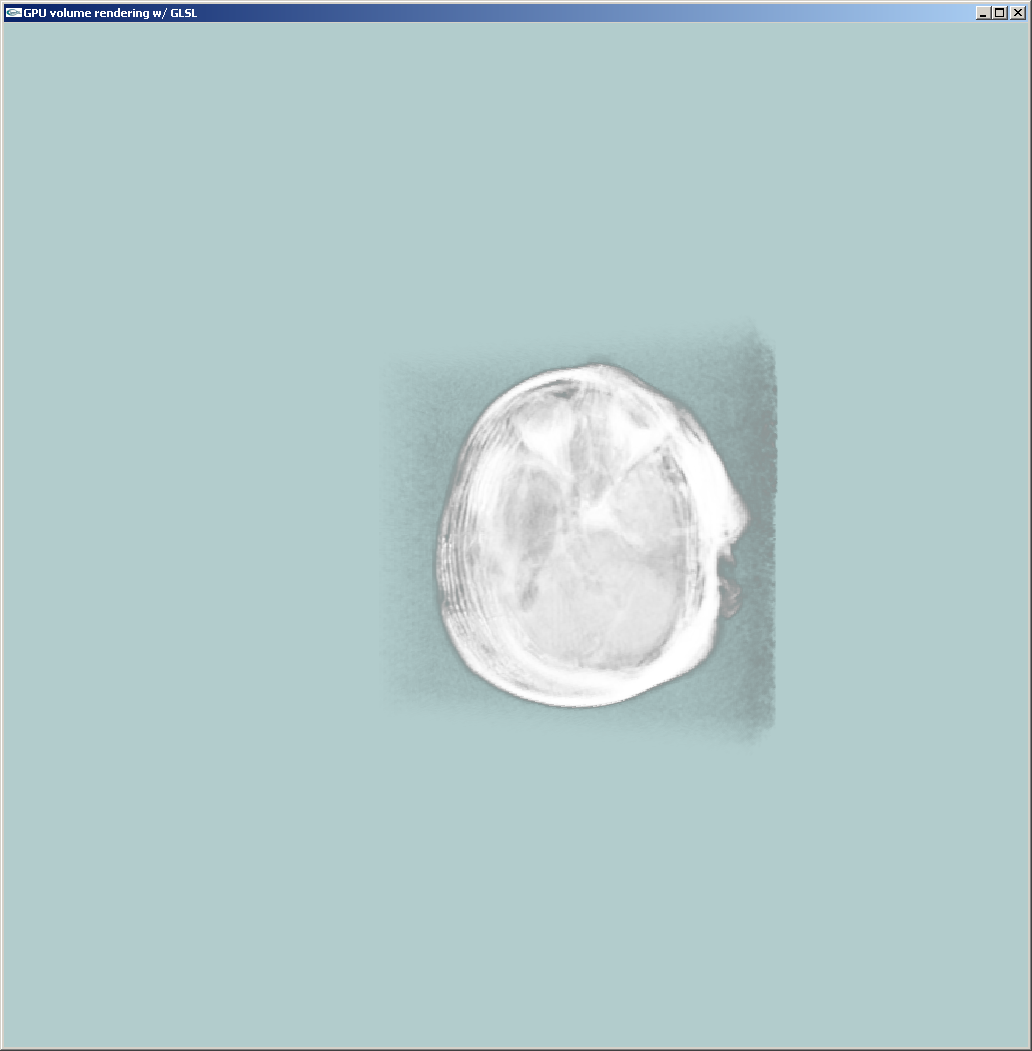
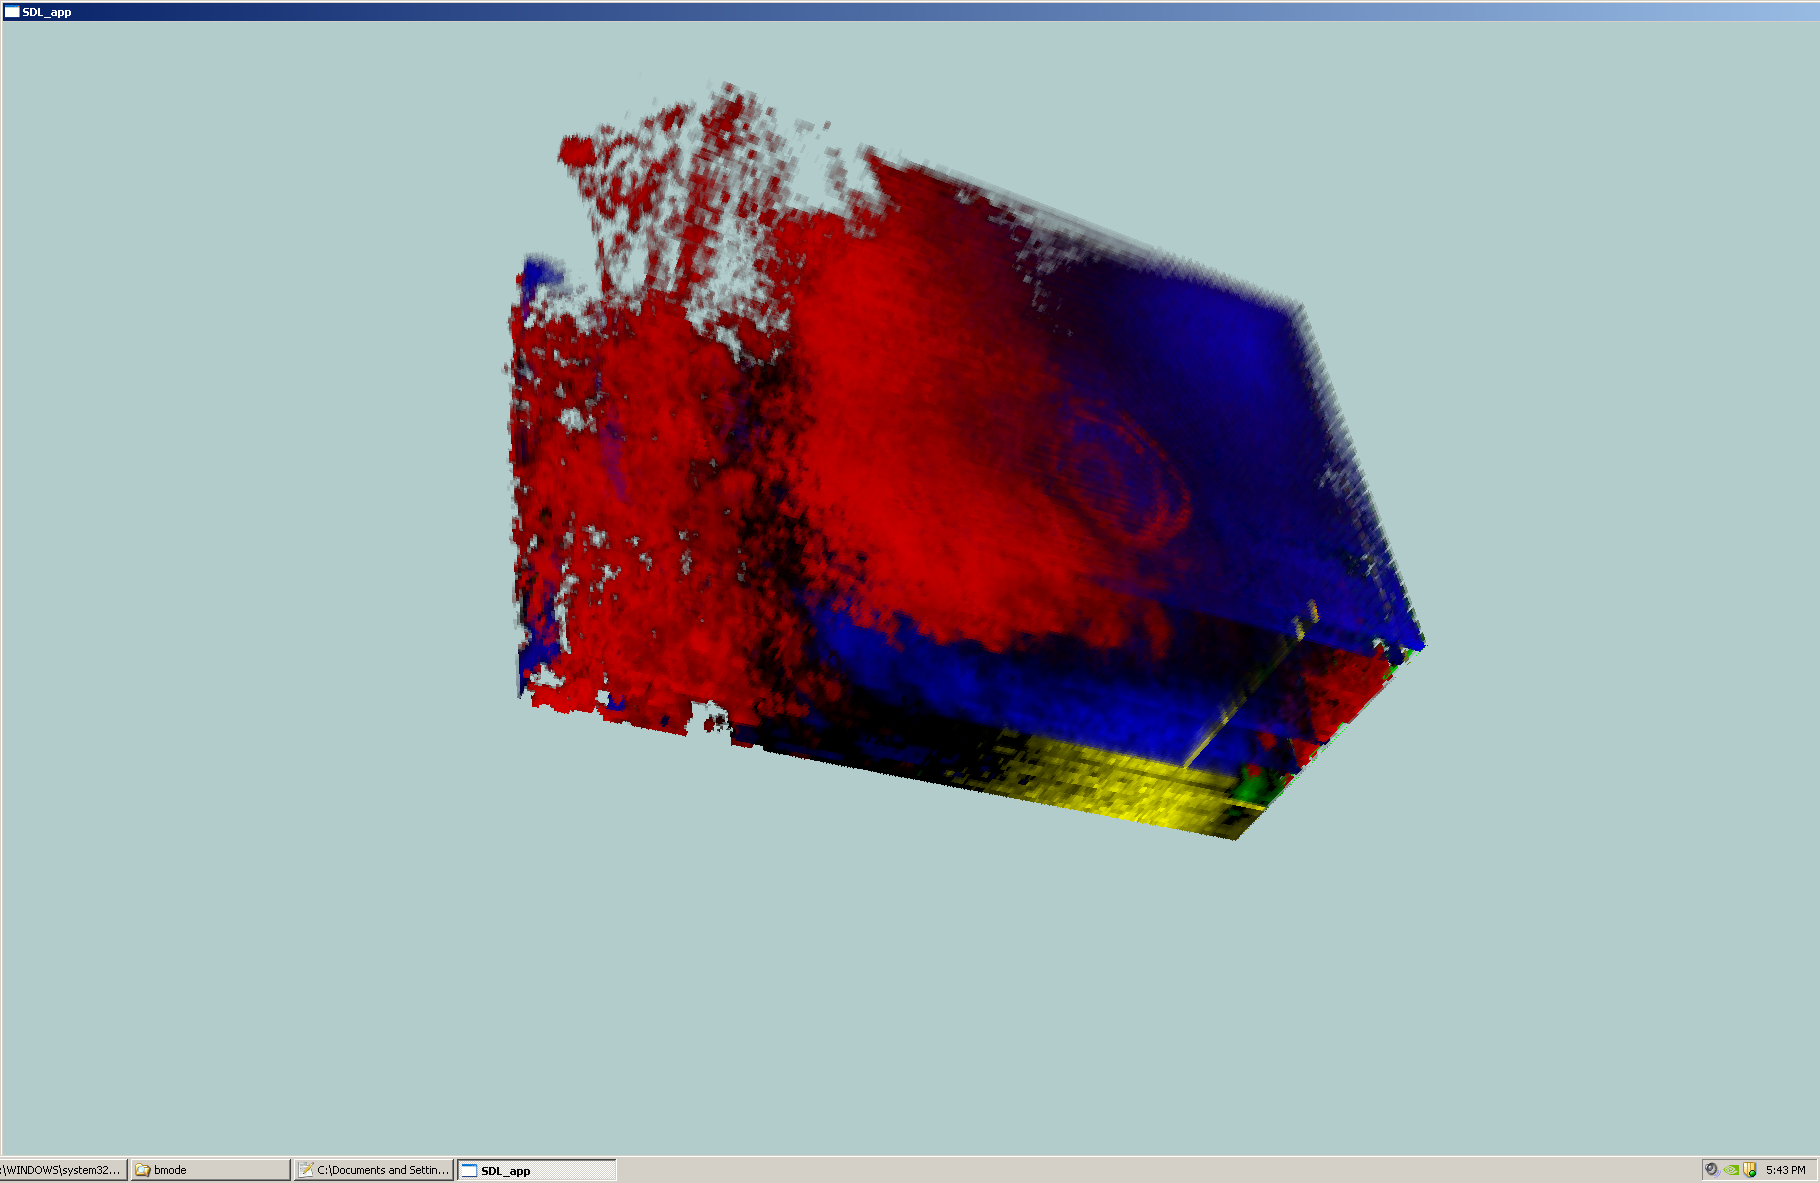
Creek is an interactive volume raycaster I wrote during a summer internship at the Lister Hill National Center for Biomedical Communications.
Under the guidance of Terry Yoo and Jesus Caban my project explored merging multiple ultrasound data streams into a single volumetric visualization in realtime.
The goal was to bring the multimodal characteristics (e.g. touch, sound) of gross physical exams to tissue imaging by giving immediate feedback while exploring areas of interest.
At the time, Creek ran on an external Nvidia Quadro Plex - a powerful (and expensive!) piece of professional non-gaming graphics hardware. I wonder if it could run on commodity hardware today?
Take a look on GitHub to see how it was made.
Technologies: C++, OpenGL + GLSL, CMake